Function Approximation Using Radial Basis Functions
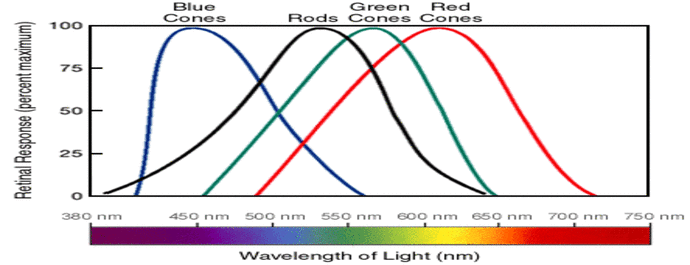
Color Specific Photoreceptors - Cones
Inside the retina are cone cells, photosensitive cells that differentiate color. Humans have 3 different types of cones; (S)mall, (M)edium, and (L)arge, corresponding to the length of the wavelength that excites it. The excitement amplitudes of each type of cone is perceived to us as color, and the color perceived is the sum of each cone response.

Radial Basis Functions
A Radial Basis Function (RBFs) is a function whose value depends the distance between a query point and a fixed point. For this exercise I used the Gaussian Function:
\[h(x)=exp(-\frac{(x-c^2)}{r^2})\]- x is the query point
- c is some fixed point, 0 if distance is measured from origin
- h(x) is the RBF
By using multiple RBFs you can approximate a function. By multiplying the RBF by some weight, summing a network of RBFs can approximate a function:
\[f(x) = \sum_{j=1}^{m} w_j h_j(x)\]- h(x) is the RBF
- w is the weight for the RBF
- j in the index for m samples of x
The weight vector can be found using linear regression, ultimately leading to this equation:
\[\overrightarrow{w} = (H^TH)^{-1}H^T\overrightarrow{y}\]- H is the design matrix of h(x), or a nxm matrix of n samples and m RBFs
- y is f(x) vectorized
In this exercise we have the following dataset:
- x is drawn from a uniform random distribution, from -10 < n < 10; n=1,000
- y = 2x + e; e is a normally distributed noise vector, $μ = 1, σ = 0$
- Use 48 RBFs, between -12 and 12 @ every 0.5 along the x axis


Fig. 1 - Dataset visualized
Fig. 2 - 48 RBFs plotted
Fig. 3 - Function prediction
Fig. 4 - Error analysis
Modeling photoreceptor response provides insight to how information is gathered and processed at the cellular level. It’s the network of these cone cells that provide the stimulus we interpret as color.