Development of a Cribbage CPU Player
Cribbage
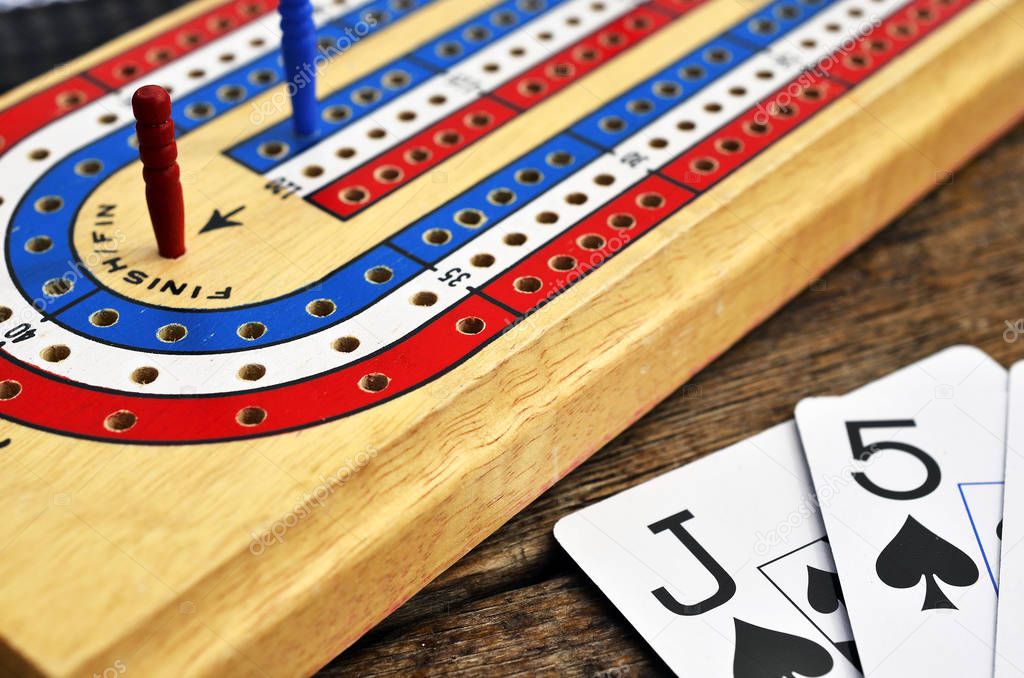
Cribbage is a 2+ person card game that uses a distinctive board to keep track of points. The game is played in hands with players discarding into a crib that alternates between counting towards each player’s score. Points are gained through card combinations in their hand and card combinations from play. The first player to 121 wins. It’s a great game to geek out on.
Stats Gone Mad
I started with a python framework from Github. This repo seemed like a good base to start from; a few other people started from it and even corrected a scoring bug. A couple of interesting things to note: first, the deck is a object made of two dictionaries, one of suits and one of ranks, and the deck itself is a list of card objects. There’s a couple of deck-specific functions built into the class, like draw() and shuffle(). There’s two built in players, one a user controls, the other random. The random player uses no analysis for cribbing or playing cards but does provide an example of what the program expects.
AI: Cribbage is a great game for stats and the nauances can make or break a game by a point. Every move and decision carries weight, and the tiniest details can spell the difference between triumph and defeat. Cribbage challenges players to master the art of precision and calculation. Whether it’s analyzing the probability of a winning hand or strategically discarding cards, the thrill lies not only in the gameplay itself, but also in the endless possibilities for statistical exploration and strategic decision-making.
Building out the CPU Player
The first thing I wanted to tackle was the decision process for discarding to the crib. The situation is static and really where all the analysis fun is. I started with evaluating starter card options. The program iterates through each hand + starter combination and tally’s up the hand score:
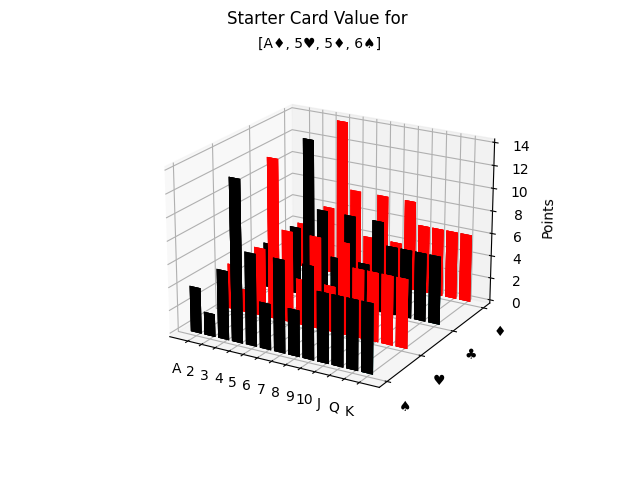
In this instance we can see any 4 card combo-ing nicely with the pair of 5’s and the 6, for two 3-card straights and two 15’s. Likewise, 5’s 7’s and 9’s receive the same score through three-of-a-kind, straights, and combos of 15, respectively. This scenarios is 1 of 46 within 14 other possible hand combinations.
Strategy
The latitude by which one hand can vary provides a great field to “play ball” in. For instance if we look at the fact that 5, 7, and 9 would all provide the same score, they do not have the same likelihood of occuring. Our hand already has two 5’s so pulling another 5 is 2 in 46 (4.34%), while a 7 or 9 is twice as likely to occur with 4 in 46 (8.70%). Similarly 4 provides us with the highest score and has a 4 in 46 chance of occuring, however, every face card is also unaccounted for and (including the 10’s) has a 16 in 42 chance of occuring, almost 1 in 3. Amazing. What do these differences in scoring and likelihood mean?
Well, we’ve really asked ourselves three-ish questions; what is the top score, what is the most probable, and what is the average?

I consolidated the data into three 3D symmetrical graphs. They are symmetrical along the diagonal because you can’t discard a card you’ve already discarded. Behind the scenes I used permutations of each hand rather than combinations because it made the math behind the scenes easier.
- The top score is probably the easiest to understand. It’s the most optimistic, the “ooo, if I just get this card I win the game” mentality, but often not very likely to happen.
- The most probable score is the score you’ll most likely receive. As mentioned before all face cards (and 10’s) have a value of 10, meaning there are 16 cards with a value of 10, as opposed to just 4. Your most likely score will bias towards what those higher cards will give you, simply because there’s more higher value cards.
- The average score fills in the gap between top score and most likely, what I call a soft indicator of hand strength. It averages score across all combinations of hand and starter.
Some of the math requires estimating the potential crib hand, which is unknowable. We can either disregard it or dive whole hog into stats, so lets get the wet suit on. Discard tables indicate the average number of points a crib will be worth if you discard a particular two-card combination and I included four in the program; Hessel, Colvert, Rasmussen, and Schell. Rasmussen is unique in that it was compiled using real world games rather than computer simulations. This helps capture some of the nuances and counter-plays that aren’t obvious even in play. The tables don’t agree on every detail — the composition of any crib is the result of a decision by two independent players, so it is impossible to arrive at absolute numbers. But taken together, they paint a good picture of what you can actually expect in your games.
Outro & Future Work
There’s a lot of places you can go armed with this information and a lot of different ways to play the game, but this is how I wrapped it up:
return crib_permus[np.argmax(score_aves)]
This returns the discard combo with the highest average score. The top score approach is too much of a silver bullet to be viable, and the most likely approach generally gives low scores (go figure). Highest average score does a good chunk of the leg work. Here’s test run against the RandomCPU player:
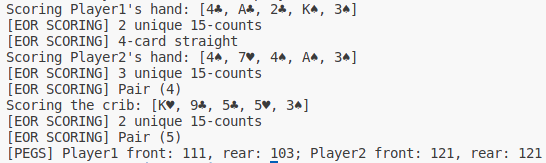
Winner!
Future work would complete the other half of cribbage gameplay, pegging. Crib discard is a lot of stat analysis, graphing, and overall strategy of the hand. Pegging on the otherhand is all tactic, but necessarily depends on the discard. There are a few guidelines and situations to follow but it should be a degree more straight-forward than crib analysis.